
We introduced several enhancements to the Heatmap functionality in the Observation Map and Patrol Map of the Analytical Toolbox, providing more accurate visualisations, greater flexibility, and improved GIS compatibility.
- Consistent Heatmaps – Heatmaps in both the Observation Map and Patrol Map now remain consistent regardless of the zoom level, making it easier to compare reports over time. Each grid cell represents the number of observations or tracks within its boundaries, as shown in the legend.
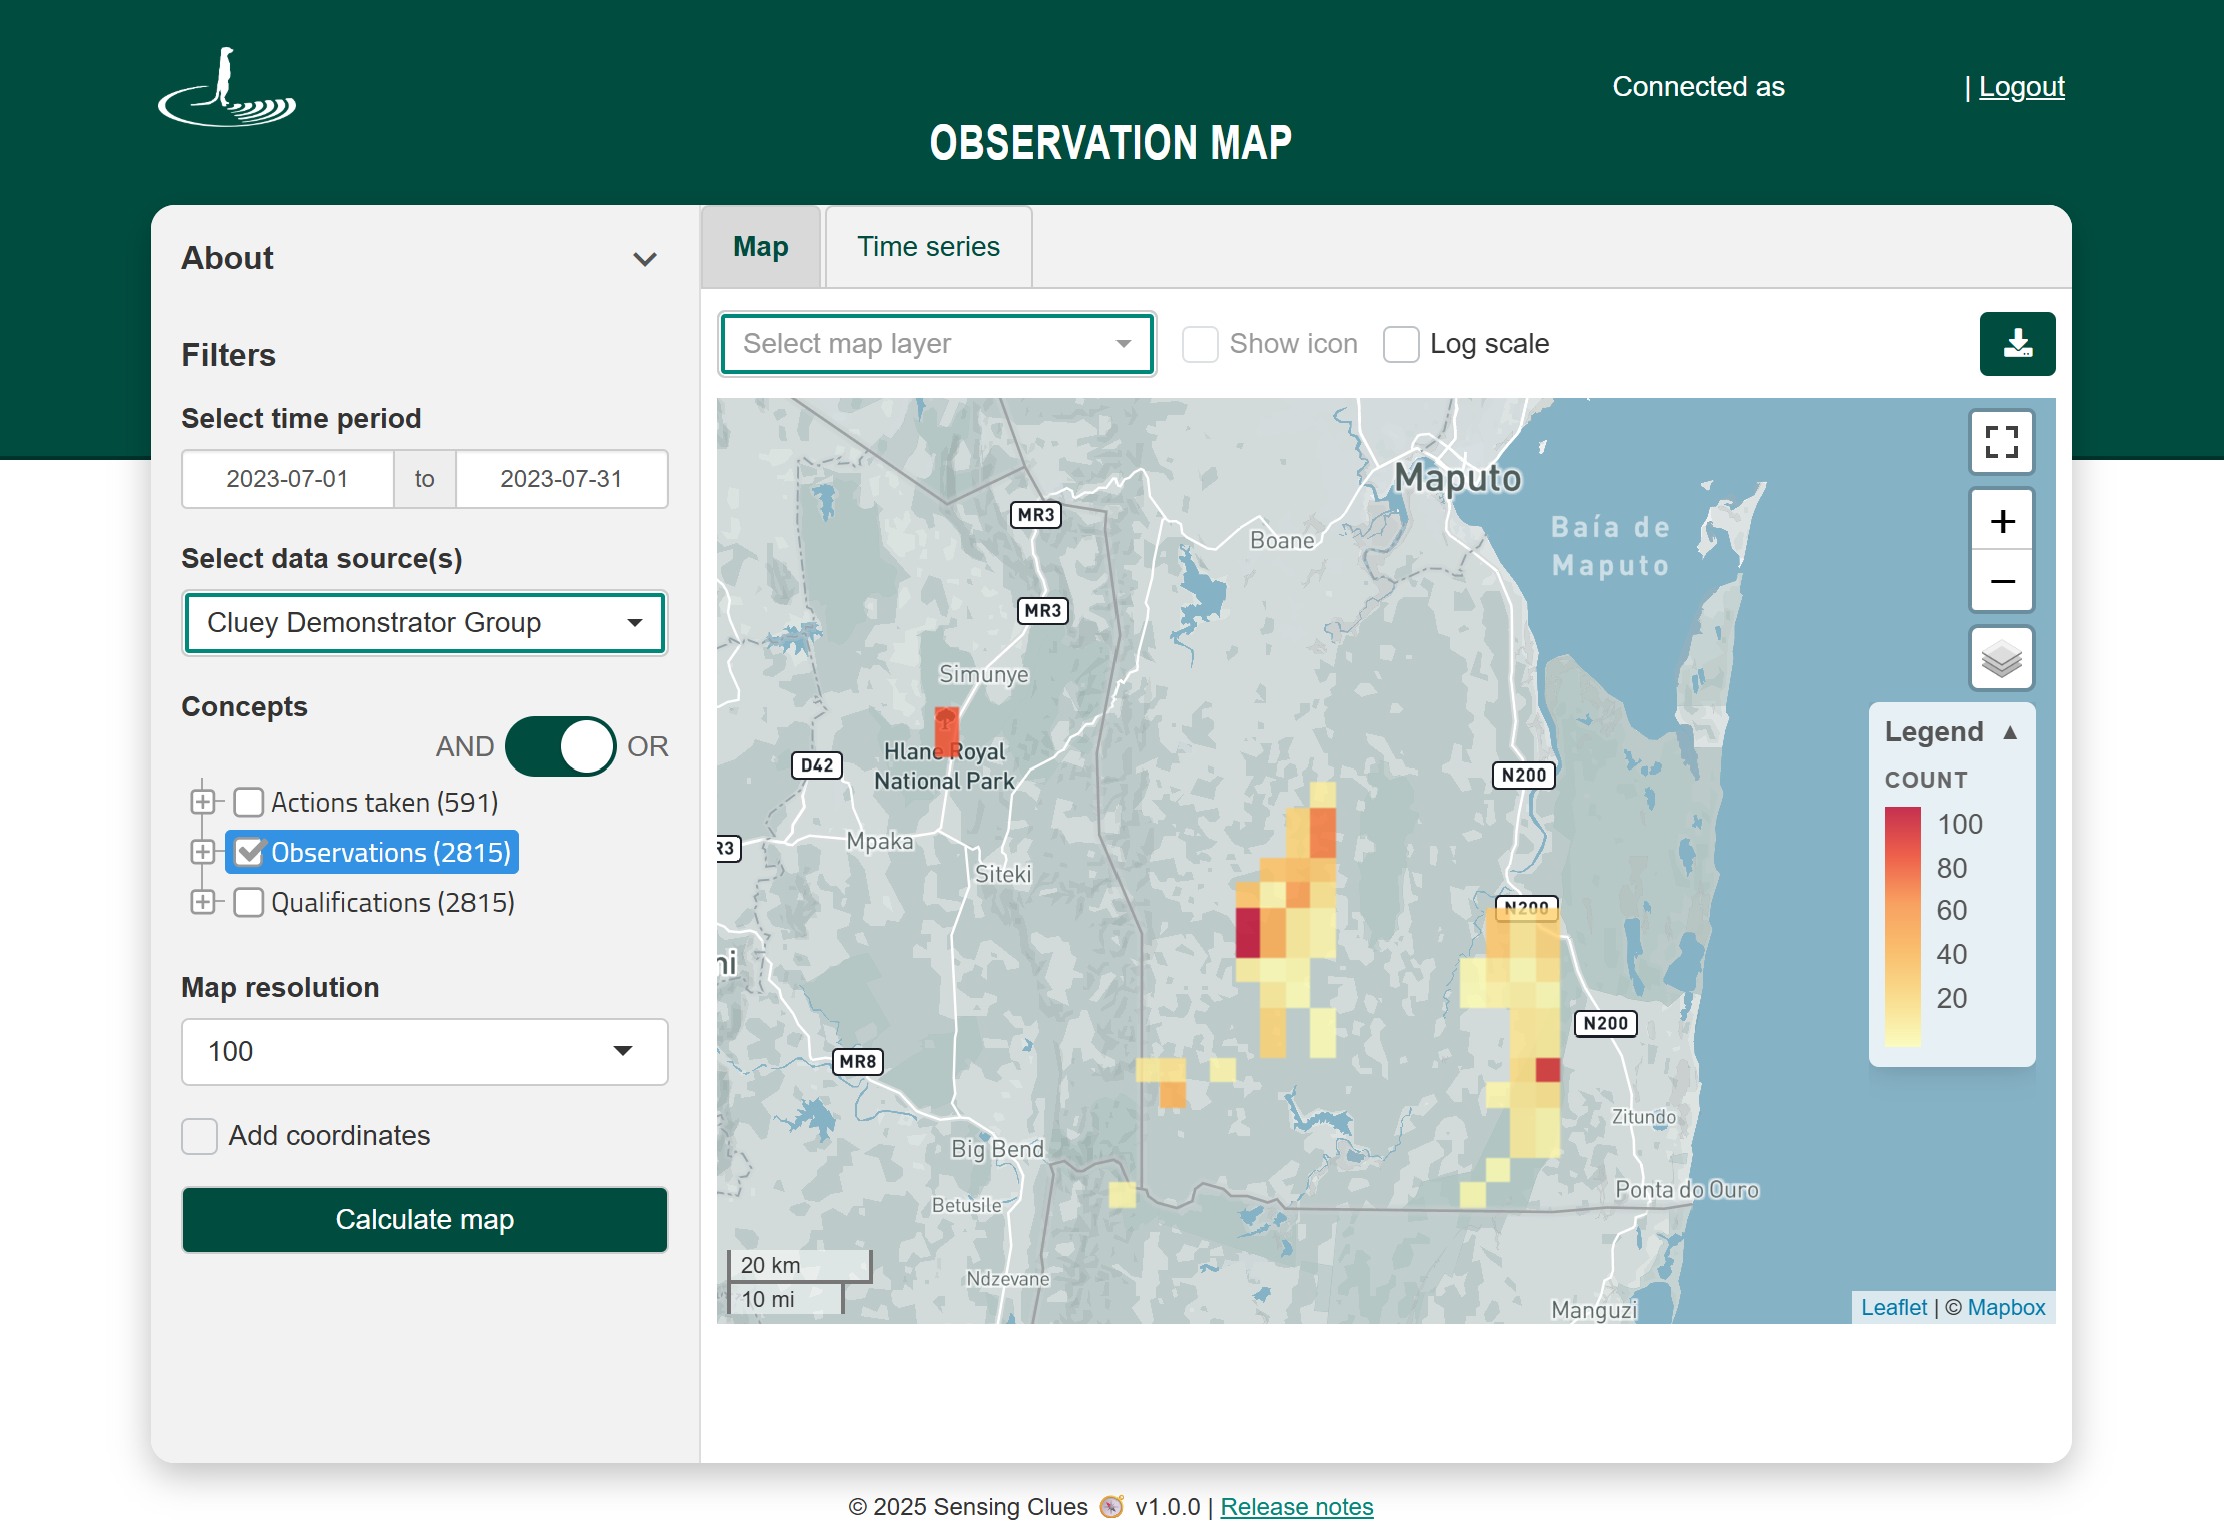
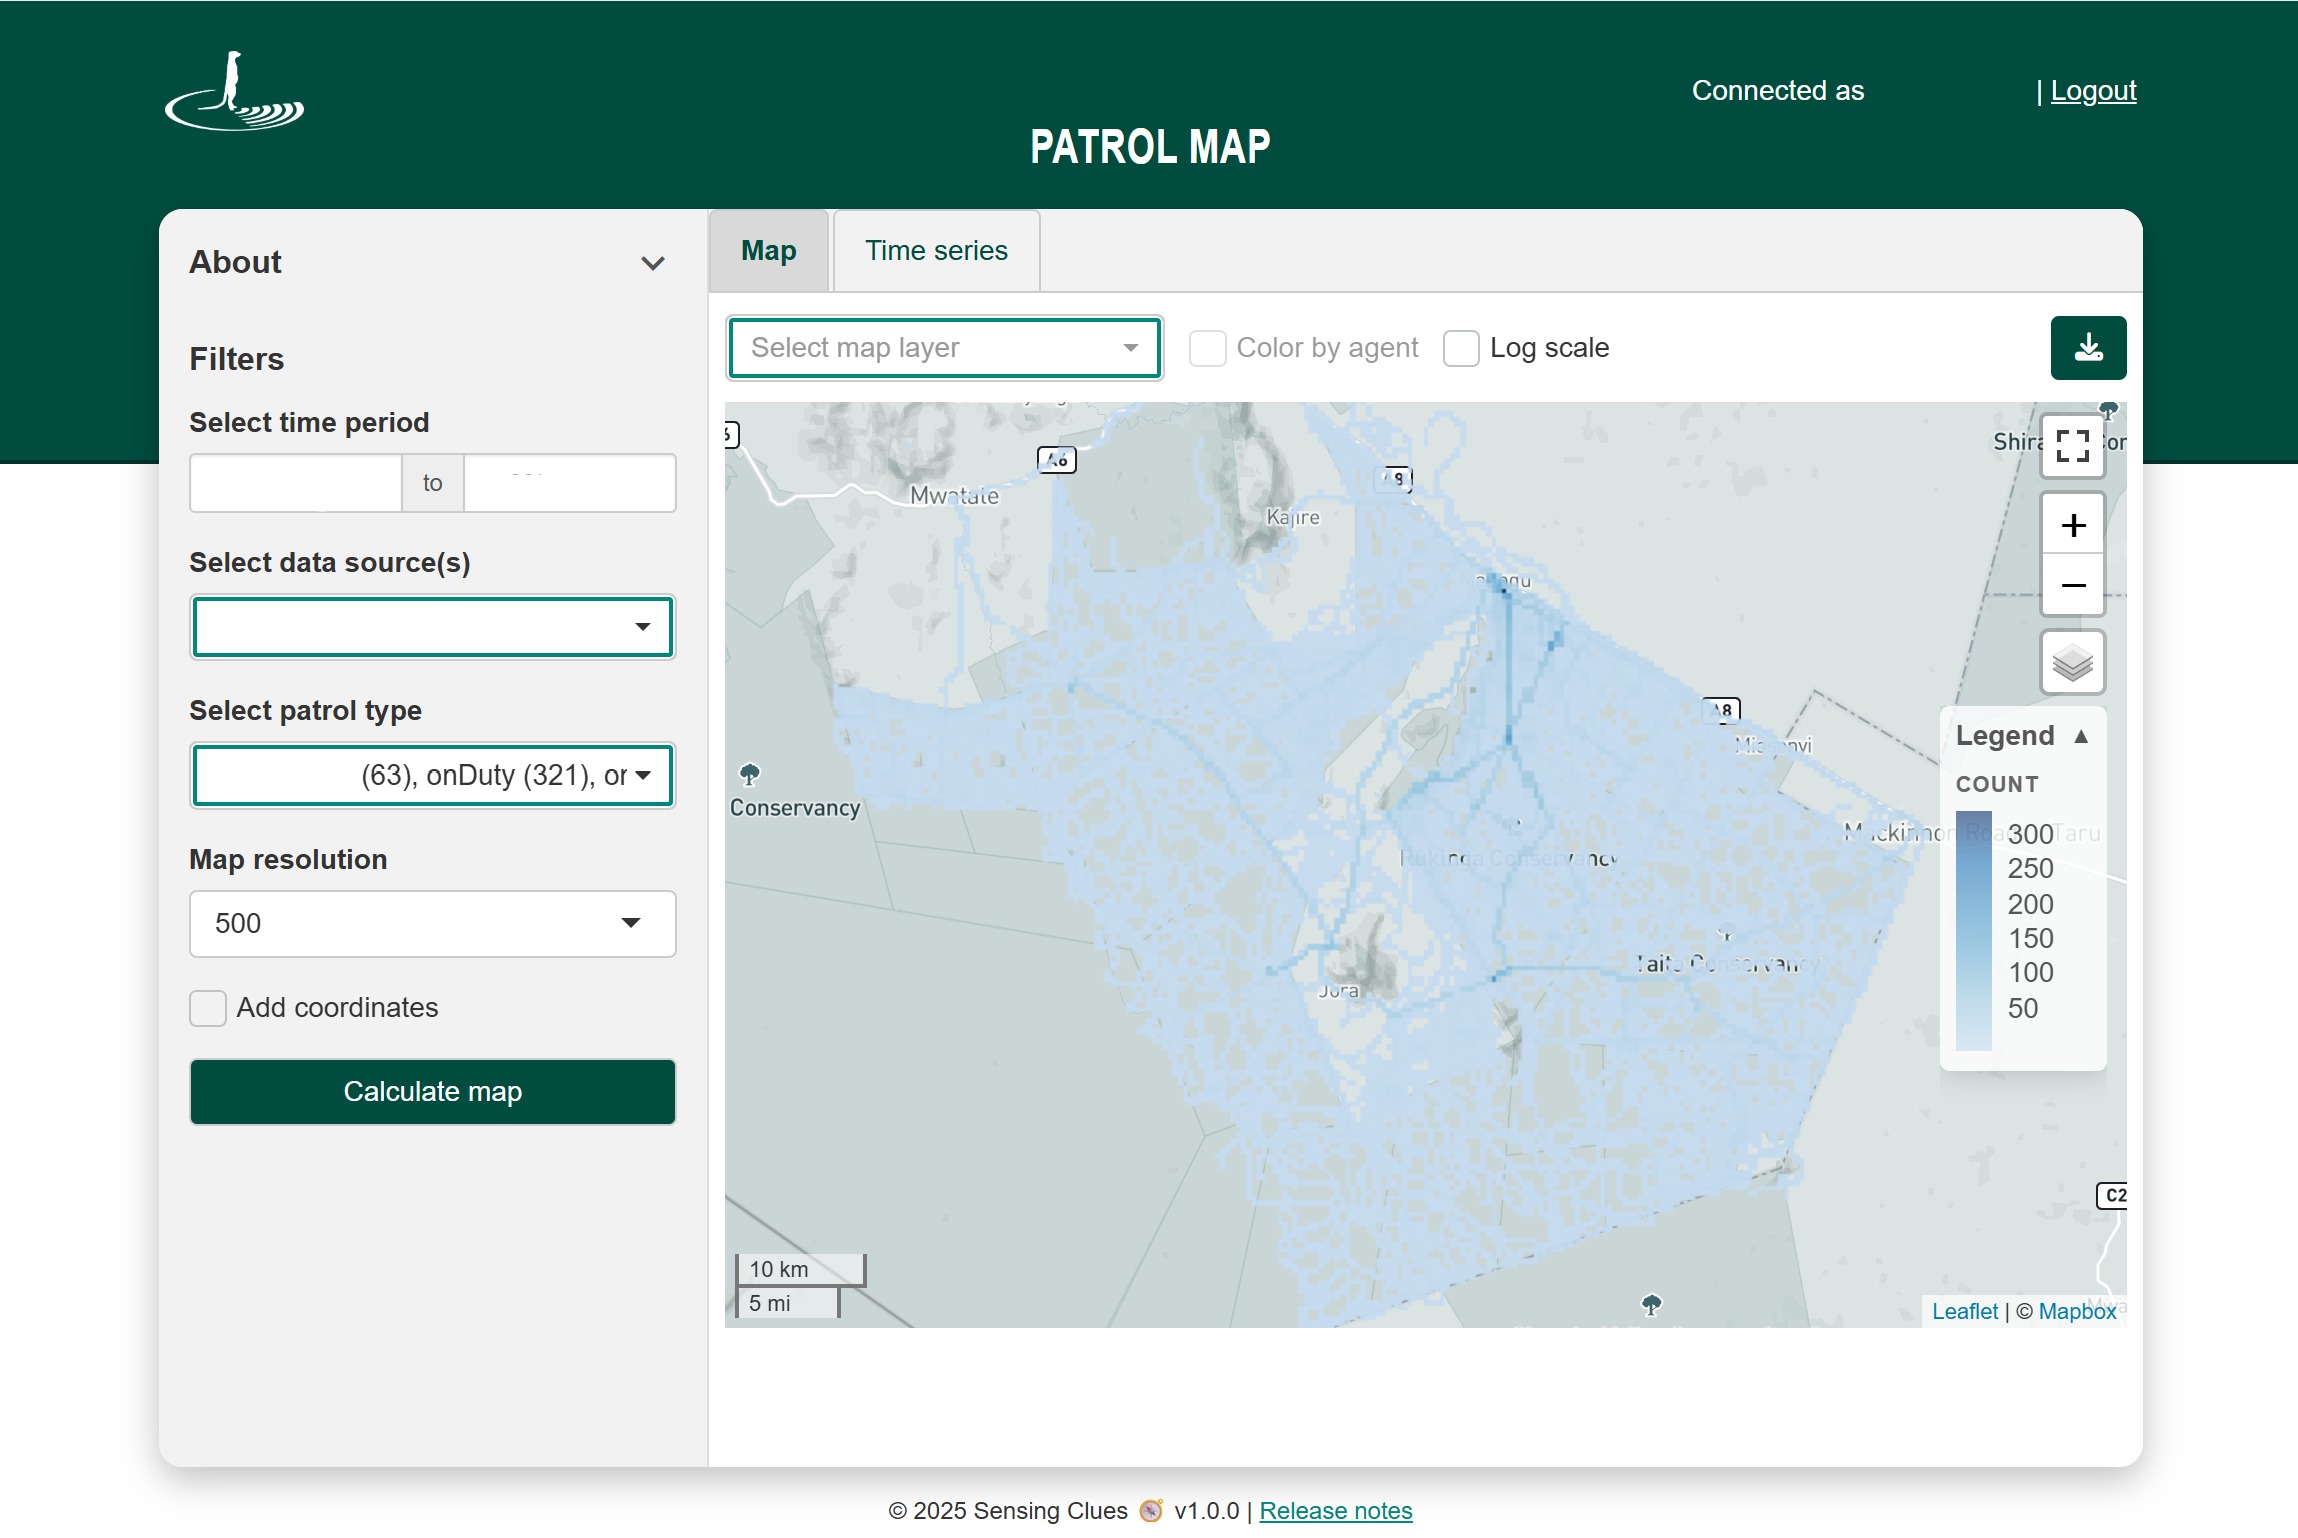
- Improved Performance – Heatmaps are now generated significantly faster, even for large datasets. To further optimise performance, collecting the underlying coordinates is now optional.
- Adjustable Heatmap Resolution – Configure the heatmap resolution to match your analysis needs. The resolution defines the number of grid cells (e.g. 100 × 100), allowing you to balance spatial detail and coverage.
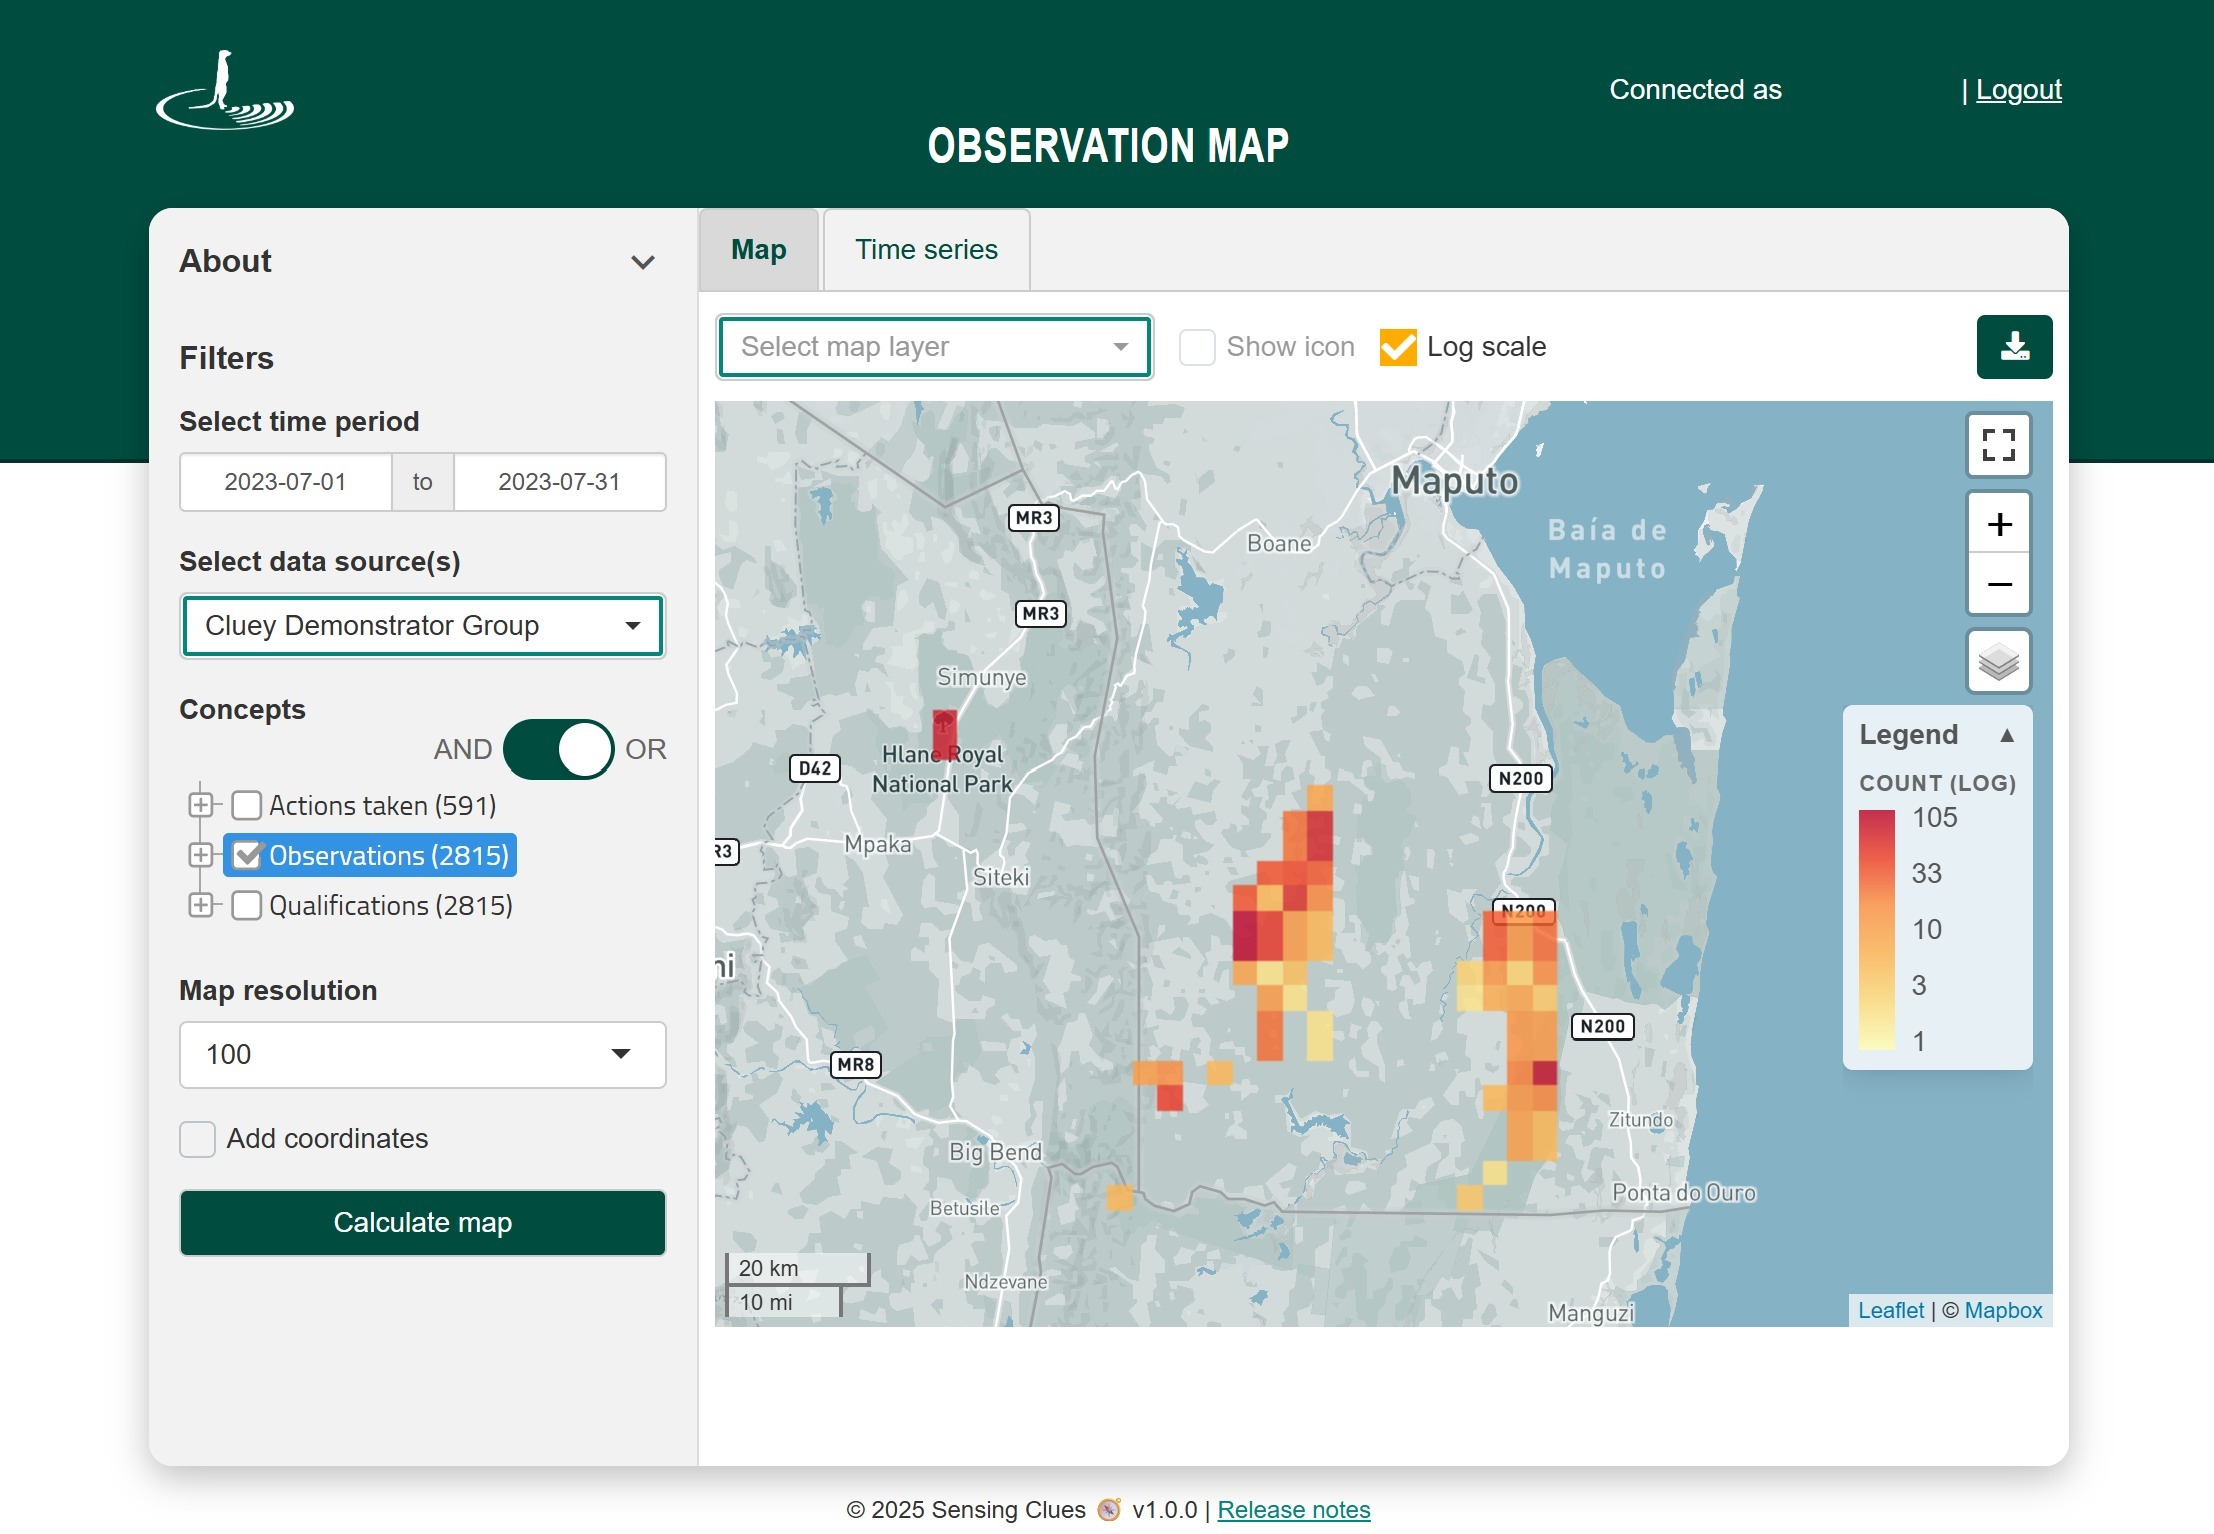
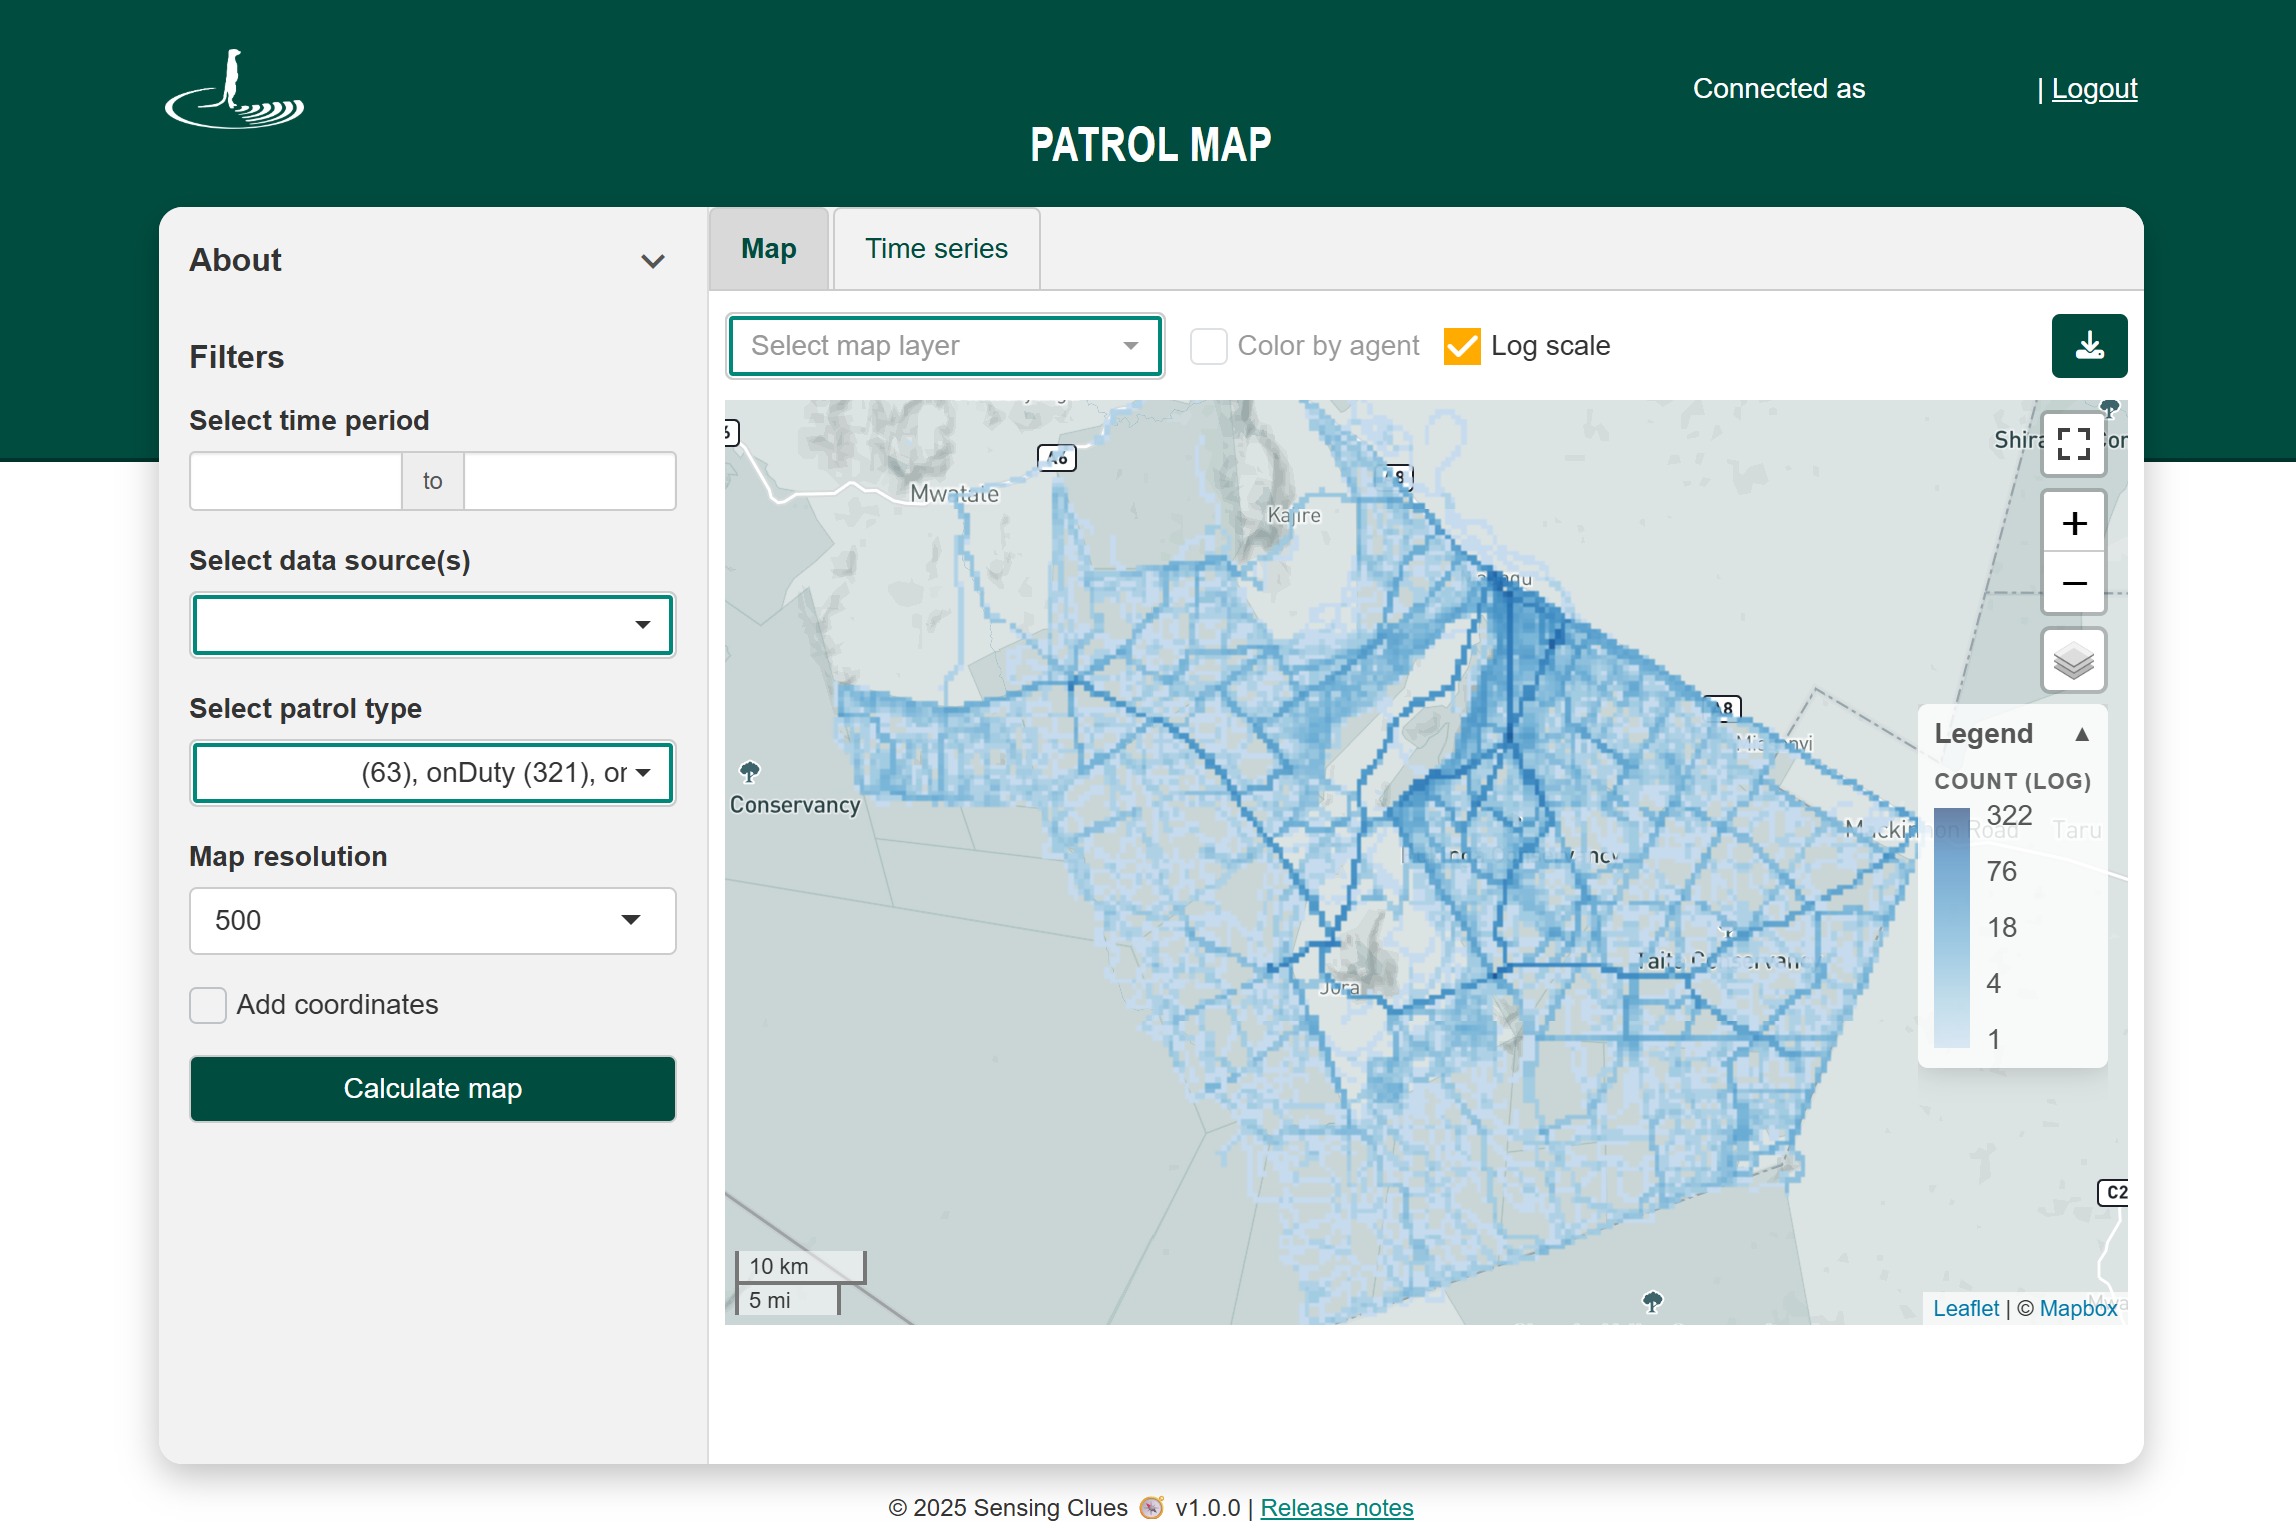
- Logarithmic Heatmap Display – Apply a logarithmic transformation to better visualise datasets with highly uneven distributions, making subtle differences between low- and high-activity areas easier to identify. The legend is updated accordingly to reflect the transformed values.
GeoTIFF Export – Download heatmaps as GeoTIFF files for further analysis and visualisation in GIS applications such as ArcGIS, QGIS, and other compatible software.
These enhancements make the Analytical Toolbox the ideal environment for advanced spatial analysis, report-ready visualisations, and GIS-compatible exports, complementing the real-time situational awareness provided by Focus 360.
Acknowledgement: The screenshots shown in this release note use data provided with the kind permission of Wildlife Works. Sensing Clues only publishes project data with the explicit consent of the respective data owners.