
Our latest enhancements give users even more powerful ways to explore observations and analyse movement patterns directly within Focus 360:
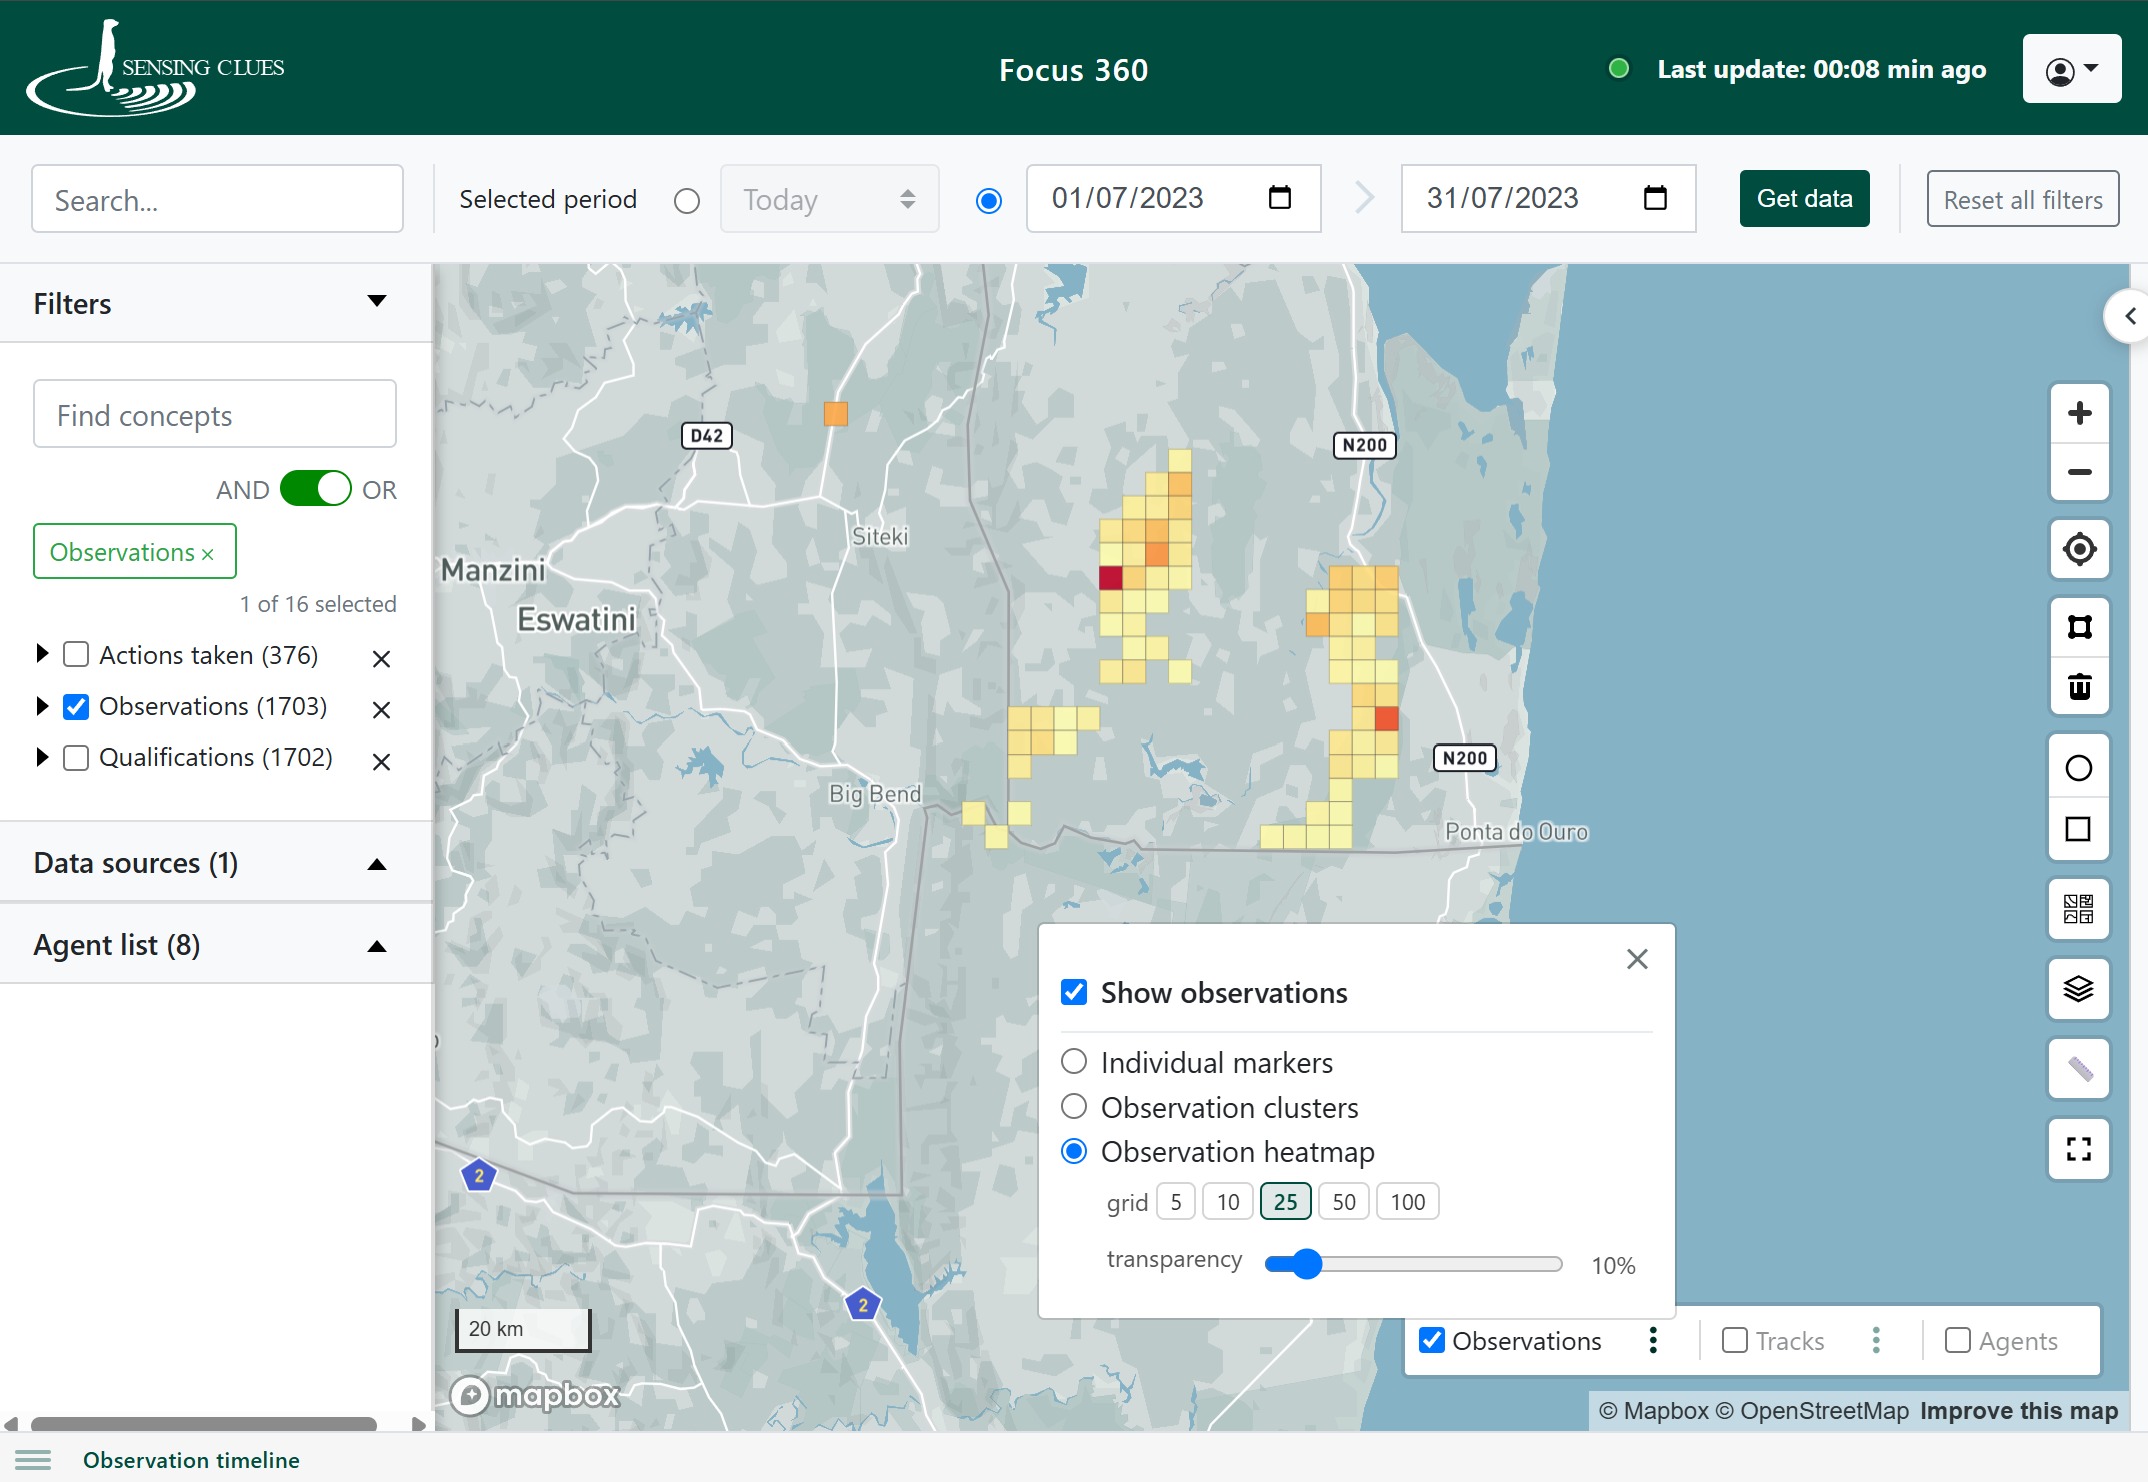
- Observation Heatmaps – In addition to points and clusters, observations can now be visualised as heatmaps using a yellow-to-orange colour gradient, making it easier to identify hotspots and areas with high observation density at a glance.
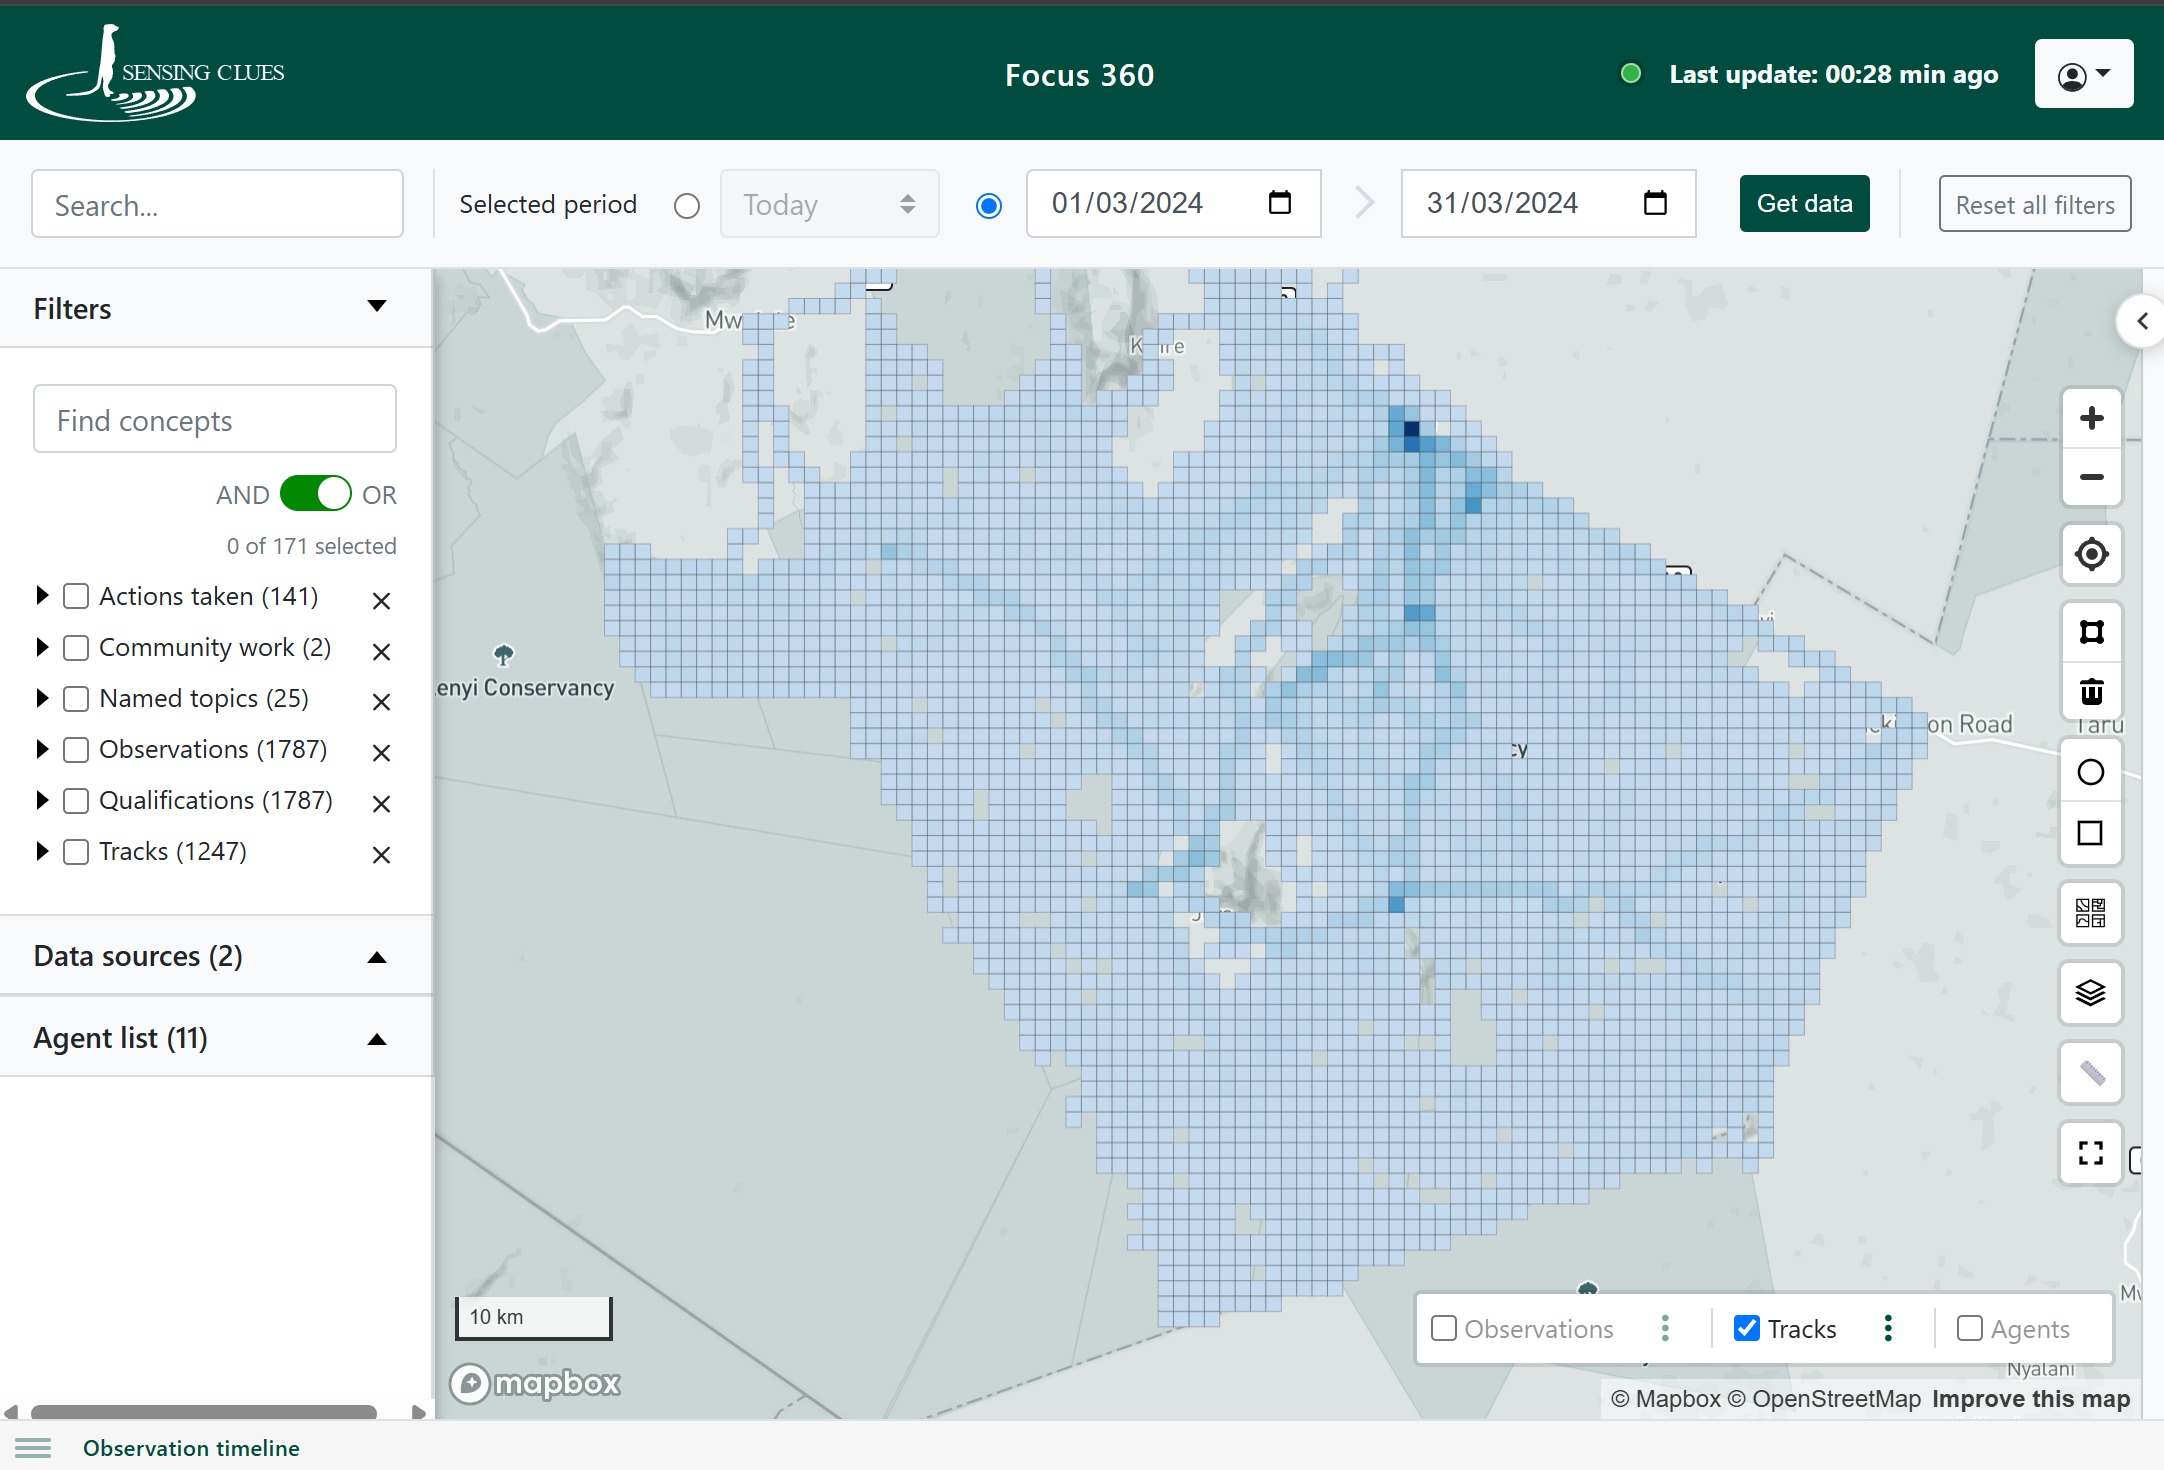
- Track Heatmaps – Tracks can now also be displayed as heatmaps using a light-to-dark blue colour gradient, highlighting frequently visited areas and revealing movement hotspots, particularly for animal GPS tracking data.
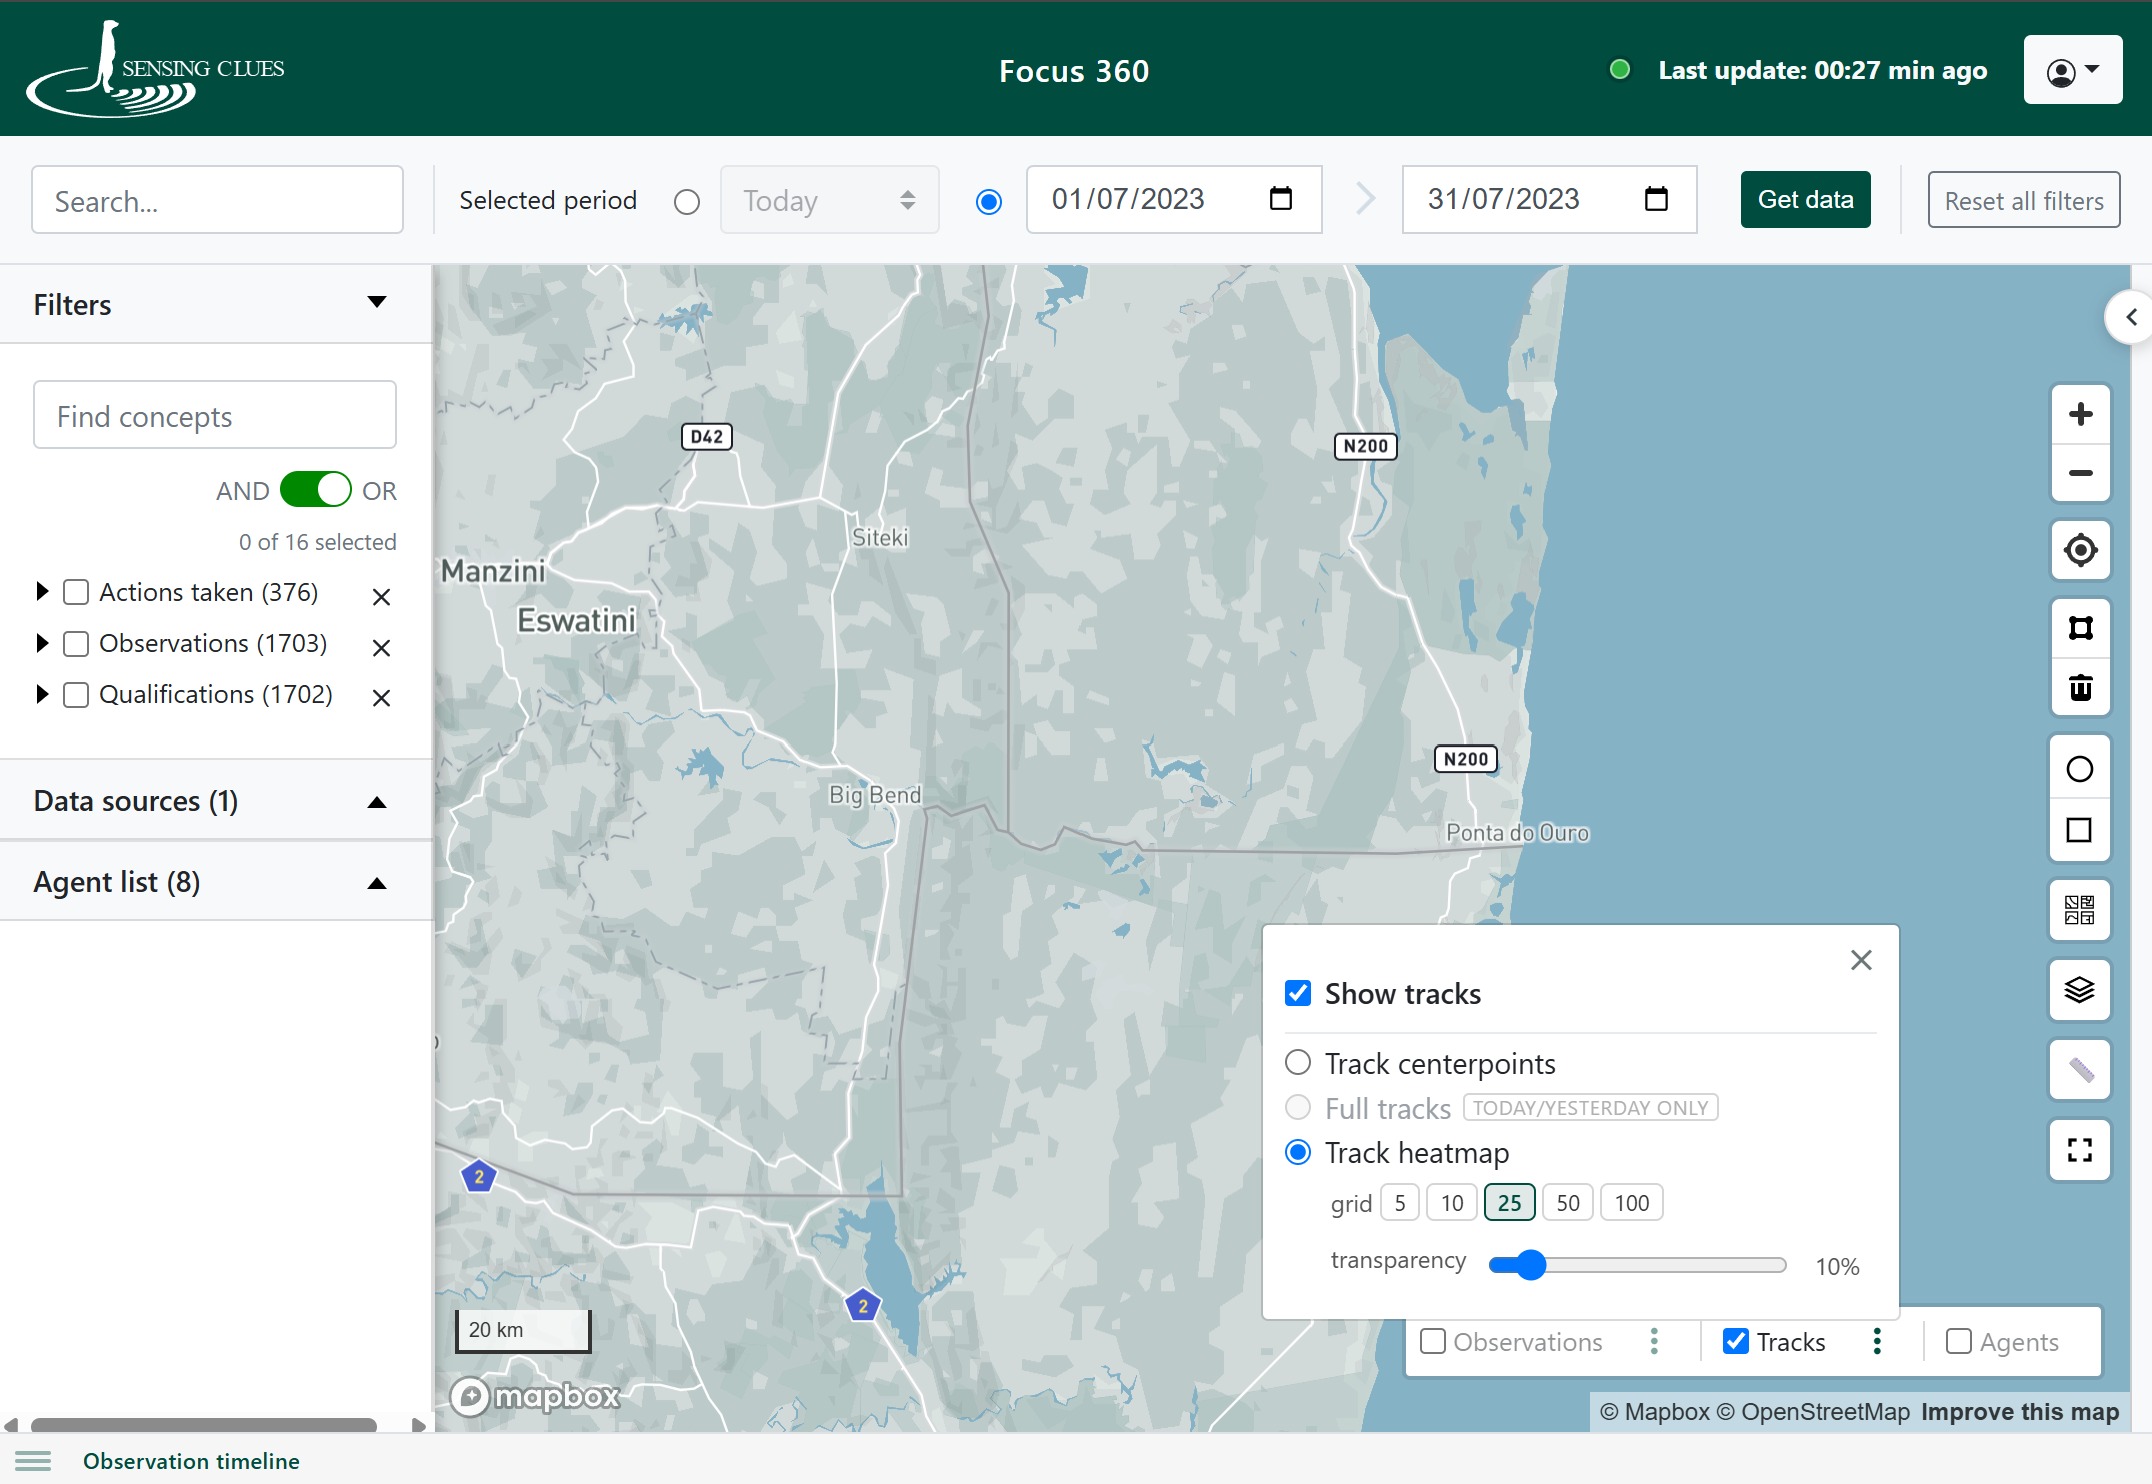
- Enhanced Track Visualisation – In addition to track centre points, complete track lines can now be displayed in high detail, providing greater flexibility when analysing patrols, animal movements, and other tracked activities. To ensure optimal performance, full track visualisation is currently available for Today and Yesterday.
- Time-of-Day Track Colours & Filtering – Individual tracks can now be colour-coded by hour of the day, making it easy to identify movement patterns over time. A built-in time slider allows users to highlight specific periods of the day, providing valuable insights into, for example, day and night activity or morning and evening patrols.
These new visualisation options provide deeper insights into both spatial and temporal patterns while maintaining the fast, responsive experience that makes Focus 360 ideal for real-time situational awareness. For more in-depth analysis, advanced visualisation options, and report-ready outputs, the Analytical Toolbox continues to provide a comprehensive analytical environment.
Acknowledgement: The screenshots shown in this release note use data provided with the kind permission of Wildlife Works. Sensing Clues only publishes project data with the explicit consent of the respective data owners.