We're excited to share the latest Focus 360 enhancement, now available to all users, making it easier to explore observation patterns and analyse data directly within Focus 360:
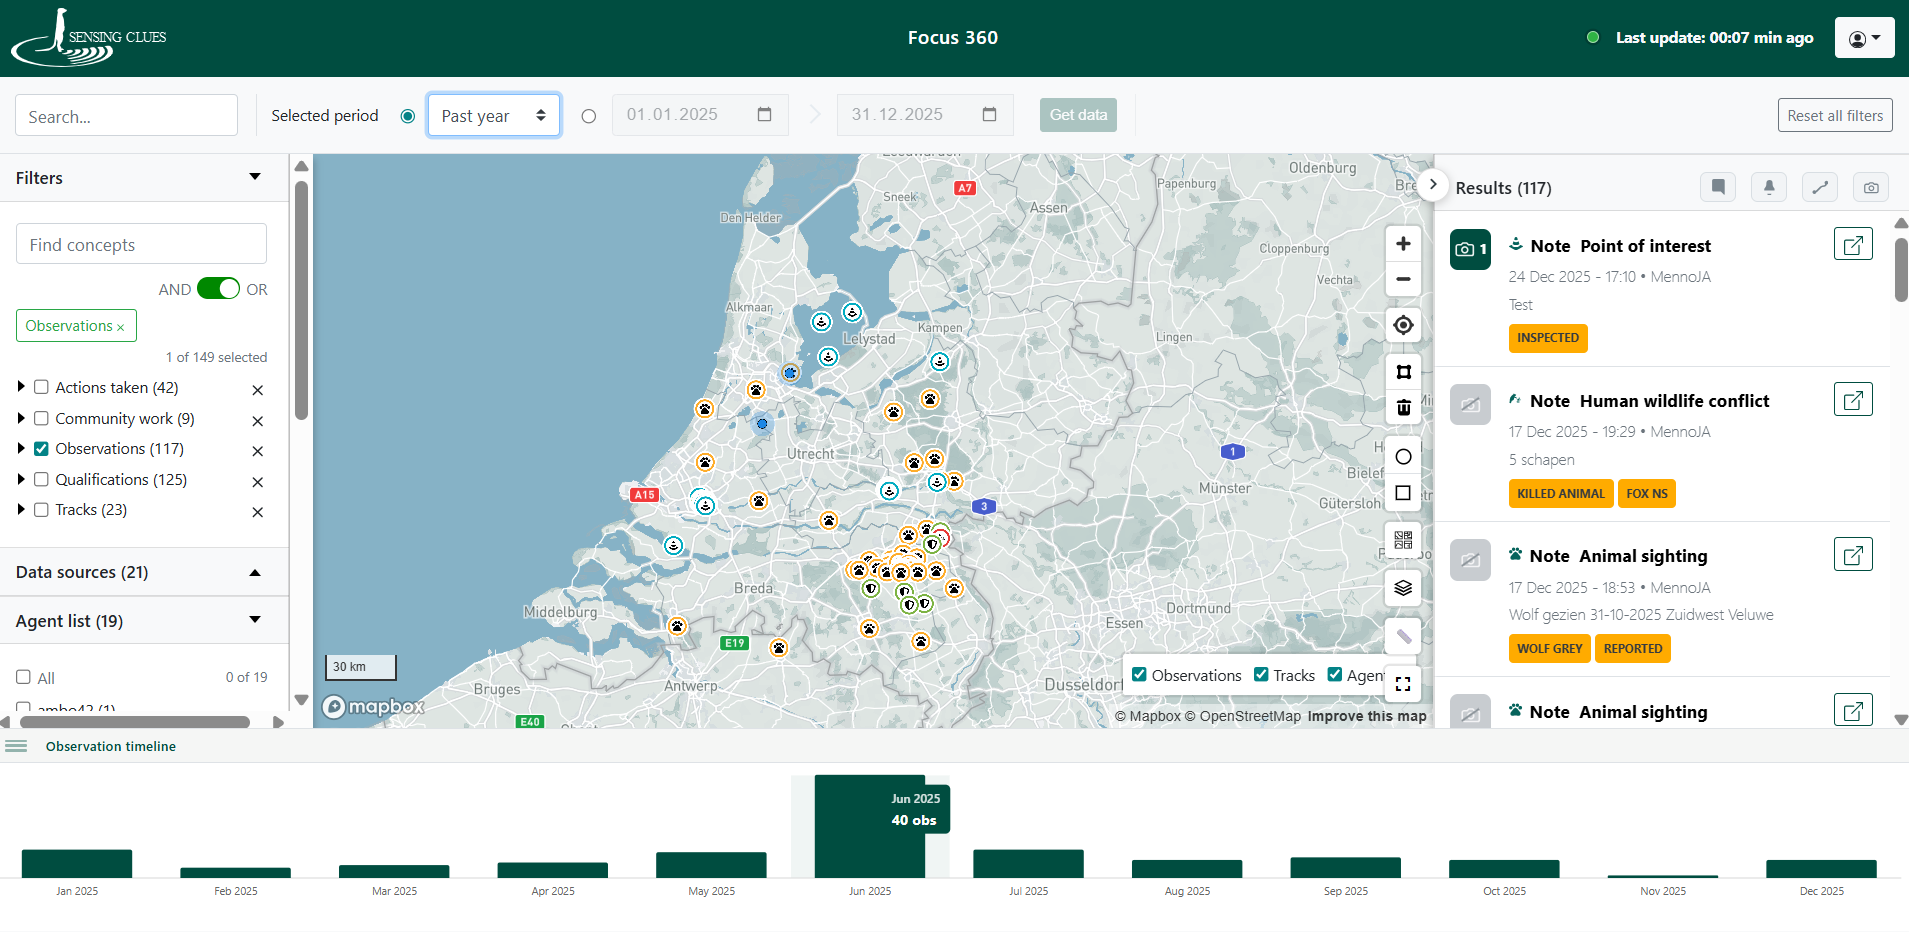
- Observation Timeline & Histogram – A new interactive histogram has been added to the footer of the application, providing a visual overview of observations over time. The timeline can be expanded or collapsed with a single click.
- Dynamic Filtering – The histogram automatically updates based on your selected filters and time period. For example, selecting "Past Year" displays monthly totals for the selected year, while "This Month" shows daily totals for the selected month.
- Interactive Drill-Down – Click on any bar in the histogram to explore data in more detail. Selecting a month, for example, drills down to daily observations and updates both the map and filters to reflect the selected period.